Chronic Pain Statistics by State

In the United States, an estimated one in five adults suffers from chronic pain, according to a 2016 CDC report. This leaves many in search of relief from what can be an elusive affliction. Chronic pain is one of the top reasons people seek medical care, emerging in the medical field as a health concern all of its own. In fact, chronic pain contributes $560 billion each year in direct medical costs, lost productivity, and disability programs, according to the CDC.
However, treating chronic pain can be difficult for providers. Chronic pain is defined as pain lasting more than 12 weeks, and it has varying causes, including initial injuries that damage the nerves and leads to intense, persistent pain, or other conditions that don’t include an initial injury, such as chronic fatigue syndrome, fibromyalgia, or endometriosis. The causes of chronic pain without injury aren’t well understood, which makes this complex issue even more complicated.
One thing is clear from the research around chronic pain, however: different demographics experience different levels of chronic pain.
The rate of chronic pain sufferers varies in groups organized by age, race, gender, education level, poverty level, veteran status, and more, according to the CDC. To try to glean more information about this elusive condition, Spruce wanted to dive into the differences among these demographics and their experiences of chronic pain, in order to paint a clearer picture of chronic pain in the U.S.
For this analysis, Spruce looked at the socioeconomic breakdown of each U.S. state in order to determine the likelihood of chronic pain persisting in its population, using data collected from the abovementioned CDC report and the U.S. Census. Below, we map out our results showing the prevalence of chronic pain in the U.S. among different demographic groups.
Overall Chronic Pain Rates by Demographic
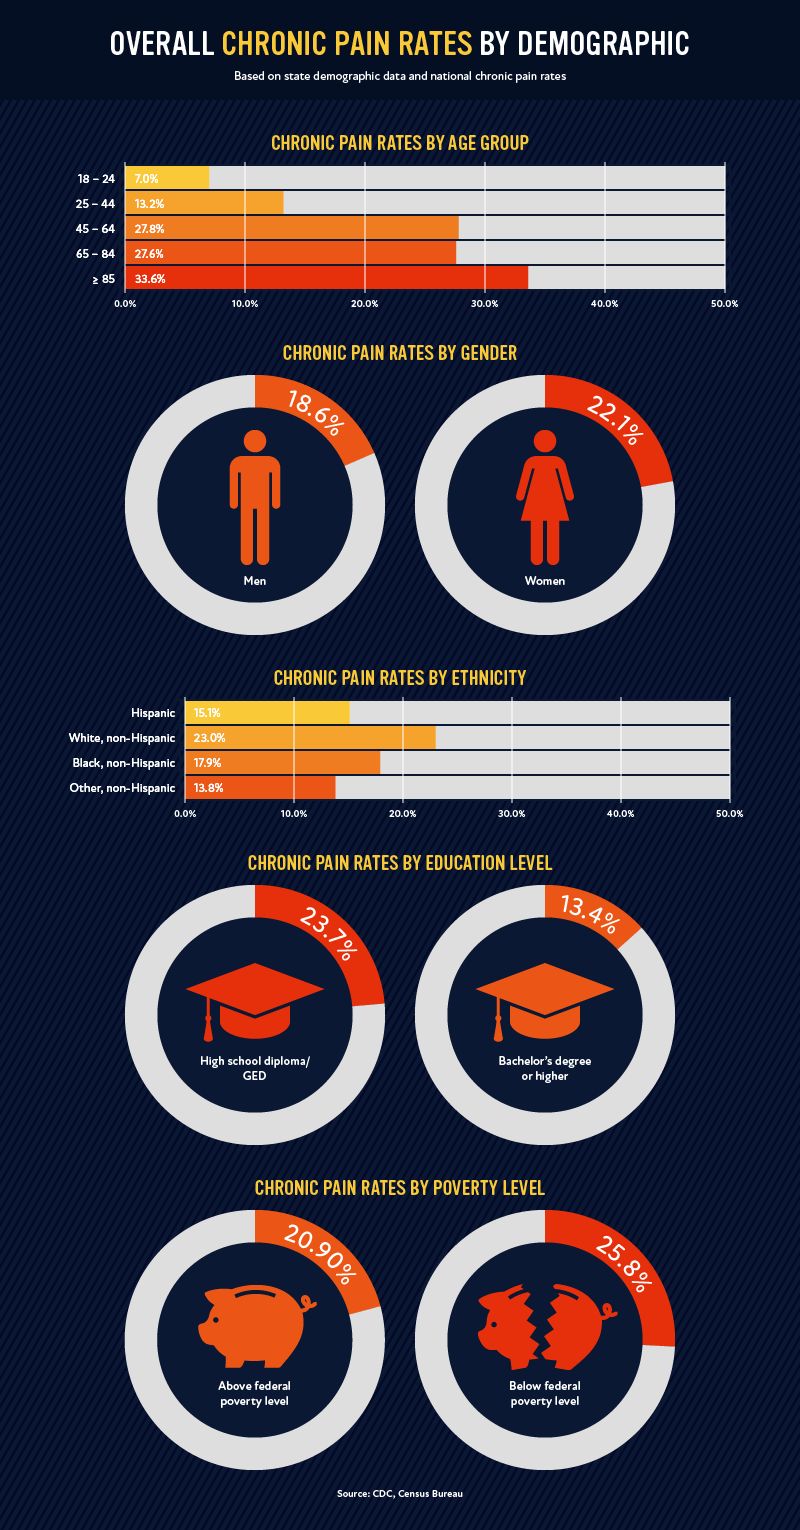
First, let’s take a look at how chronic pain rates actually differ among different demographics. As you can see in the graphic above, your likelihood of experiencing chronic pain generally increases the more you age, with the exception of 45 to 65-year-olds being slightly more likely (27.8%) to suffer from chronic pain than those aged 65 to 84 (27.6%). When looking at differences among ethnicities, the White, non-Hispanic population is the most likely to suffer from chronic pain (23%), followed by the Black, non-Hispanic population (17.9%).
Women are more likely to suffer from chronic pain than men, with 22.1% of women and 18.6% of men reporting to experience the condition. Those with bachelor’s degrees and those above the federal poverty level are also significantly less likely to suffer from chronic pain. According to the CDC, this may be due to the fact that “indicators of socioeconomic status such as education, poverty, and health insurance coverage have been determined to be associated with both general health status and the presence of specific health conditions as well as with patients’ success in navigating the health care system.”
Next, we’ll take a look at how these numbers impact state populations across the United States.
U.S. Chronic Pain Maps by Demographic
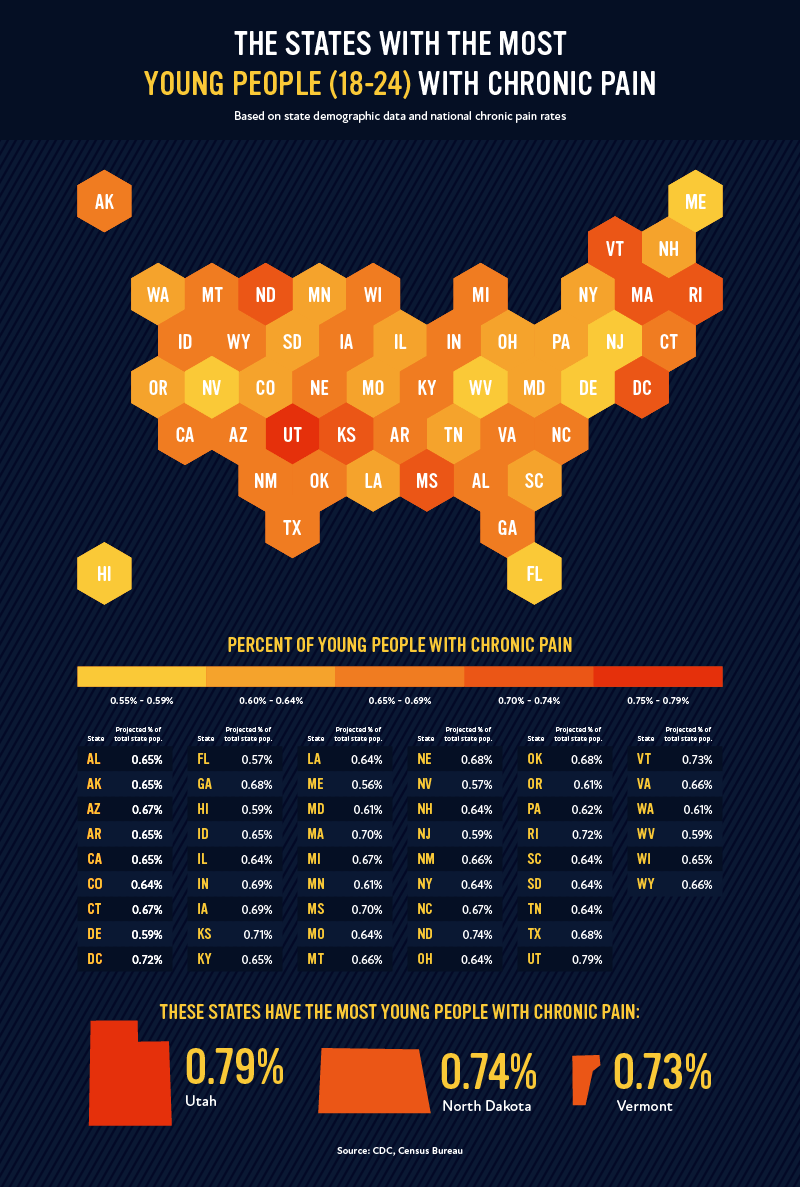
While chronic pain is a condition typically associated with older populations, 7% of Americans aged 18-24 suffer from it. In the above map, we break down the states with the largest share of their population that are young people with chronic pain. As you can see, the states with the most young people with chronic pain include Utah (0.79%), North Dakota (0.74%), and Vermont (0.73%).
While these numbers are small in comparison, it’s important to raise awareness about these conditions, as they can affect individuals’ ability to work, study, and take part in daily activities. Young people are also at an increased risk for opioid addiction, which is particularly dangerous when considering that opioid prescriptions are common methods of treatment for chronic pain. Other risk factors for opioid misuse or addiction include past or current substance abuse, untreated psychiatric disorders, and social or family environments that encourage misuse.
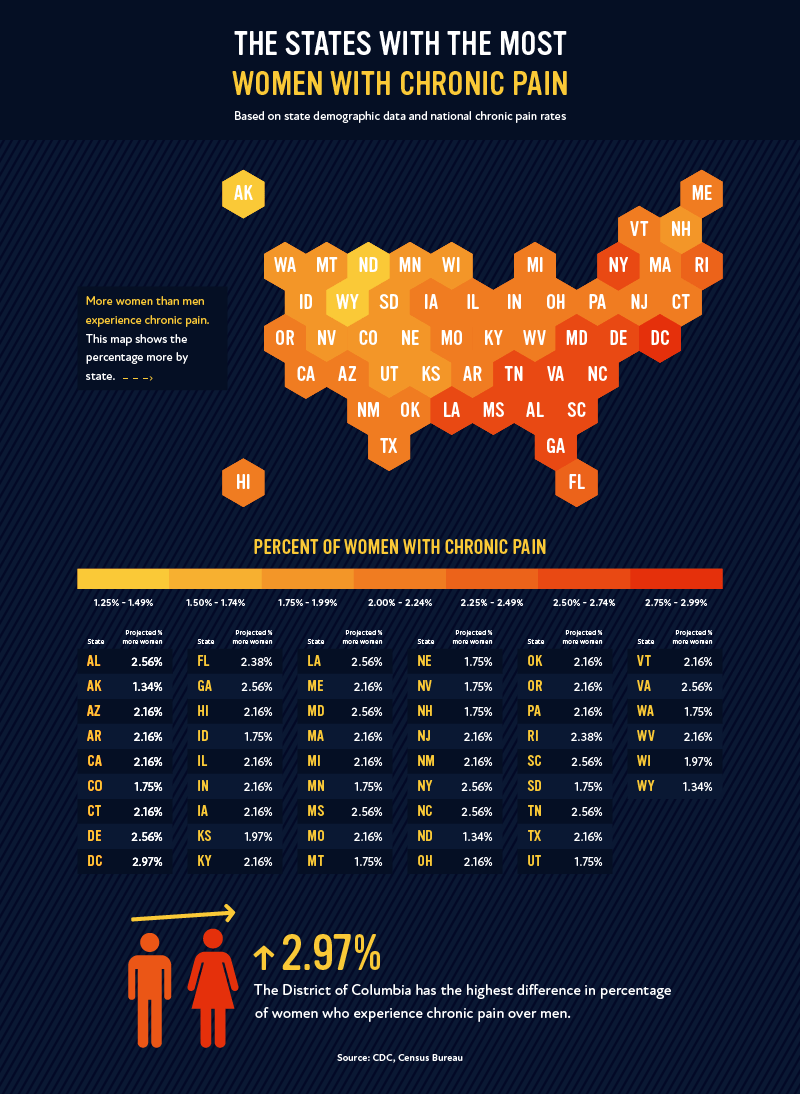
Being female means you are more at risk for chronic pain. In the above map, we display the difference in the percentage of women who experience chronic pain than the percentage of men who do by state. According to our analysis, women in the southeastern part of the country are most likely to experience chronic pain. In our nation’s capital, Washington D.C., the difference between the genders is largest, at 2.97%.
Women are more likely to experience chronic pain for a number of reasons, including hormones, puberty, reproductive status, and menstrual cycle status. Some conditions that cause chronic pain are much more prevalent in women, as well. For example, 80 to 90 percent of people diagnosed with fibromyalgia are women, according to the National Institutes of Health. Additionally, an estimated 2 to 10 percent of American women aged 25 to 40 suffer from endometriosis. The more awareness we can raise around where these issues exist, hopefully, the more people can seek out the help they need.
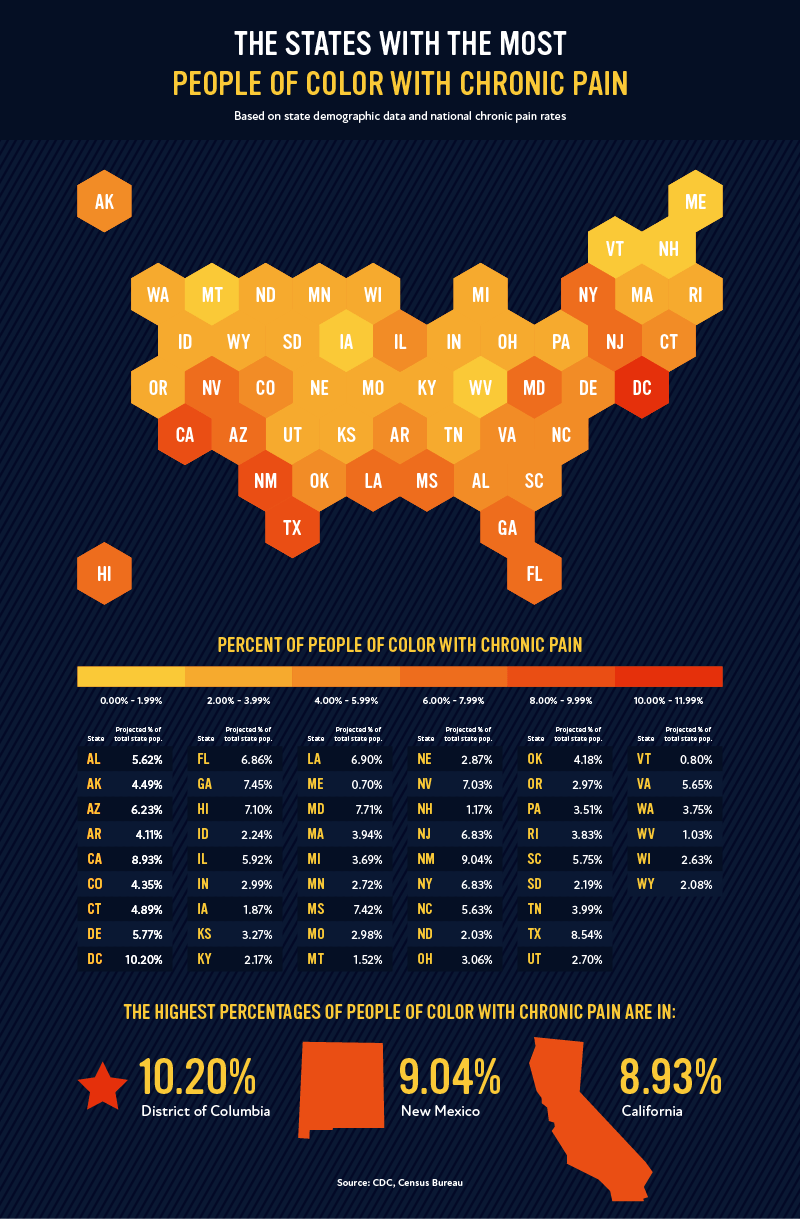
Race and ethnicity also play an important role in the experience of chronic pain in the United States. While White, non-Hispanic people have the highest rates of chronic pain, minority ethnicities may experience difficulty or discrimination when receiving care. In light of that, we wanted to highlight the states with the most People of Color (POC) who experience chronic pain.
In the United States, the highest percentages of the total state population are in the District of Columbia (10.2%), New Mexico (9.04%), and California (8.93%). These numbers include Black, Hispanic, and other non-Hispanic minority ethnic groups.
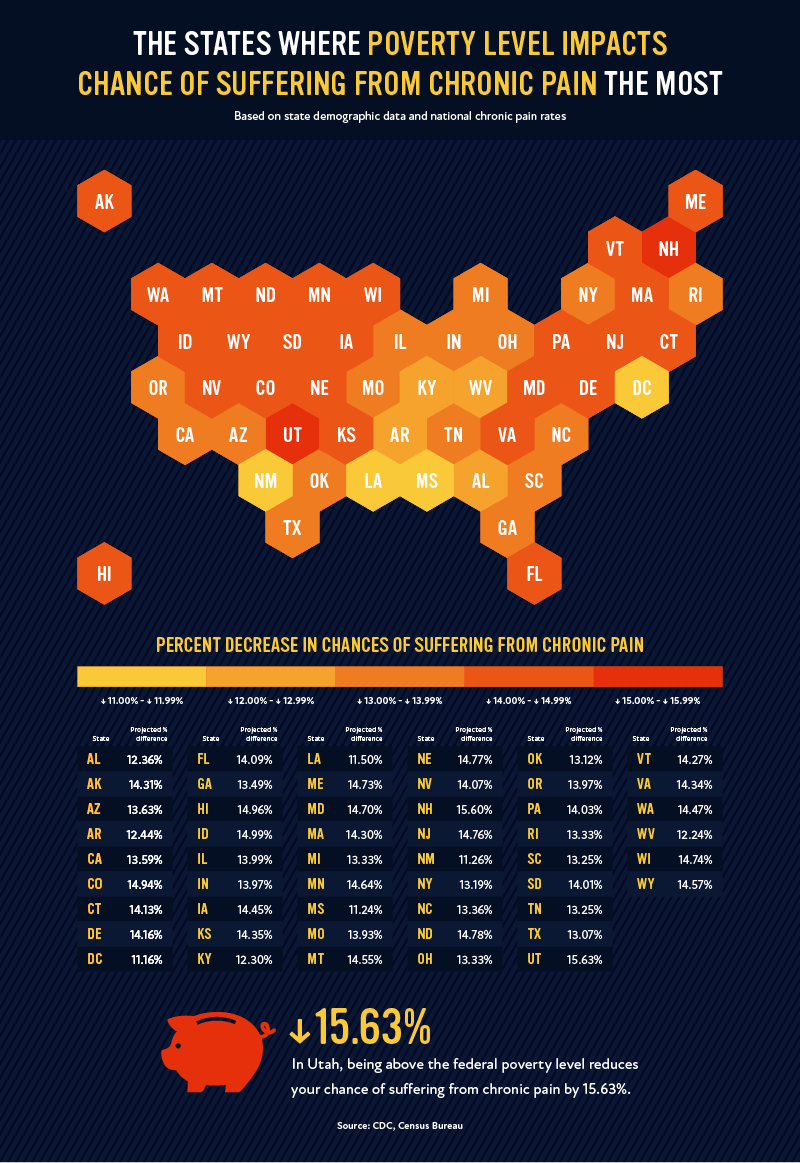
In addition to things we cannot control such as age, race, and gender, other socioeconomic factors impact patients’ likelihood of experiencing chronic pain. One of the largest indicators is being above or below the federal poverty level. Passing the threshold of poverty reduces your likelihood of experiencing chronic pain by nearly 5% in the United States.
The largest disparity occurs in the state of Utah, where being above the federal poverty level reduces your chance of suffering from chronic pain by 15.63%. Another major difference occurs in New Hampshire, where the difference is 15.60%. As we discussed earlier, comparing groups that do not experience poverty to those who do often display an increase in quality medical care as well as general health correlated to higher income.
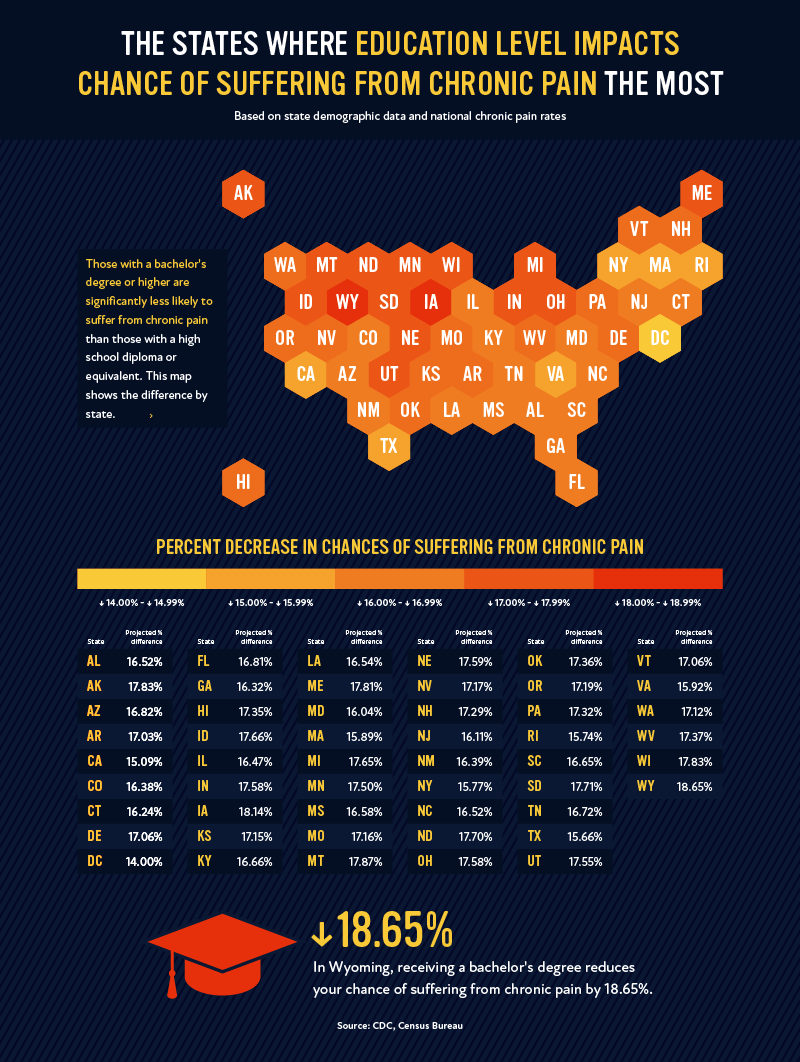
The education level of different populations significantly impacts their chances of experiencing chronic pain: namely, those with a bachelor’s degree or higher are over 10% less likely to suffer from chronic pain. In the map above, we break down where that disparity is the largest across the country.
In the states of Wyoming and Iowa, receiving a bachelor’s degree decreases your likelihood of experiencing chronic pain the most, by 18.65% and 18.14%, respectively. These numbers are of course related to the impact of poverty we discussed above, as receiving higher education is correlated with higher income, and in many cases, insurance coverage and quality of life.
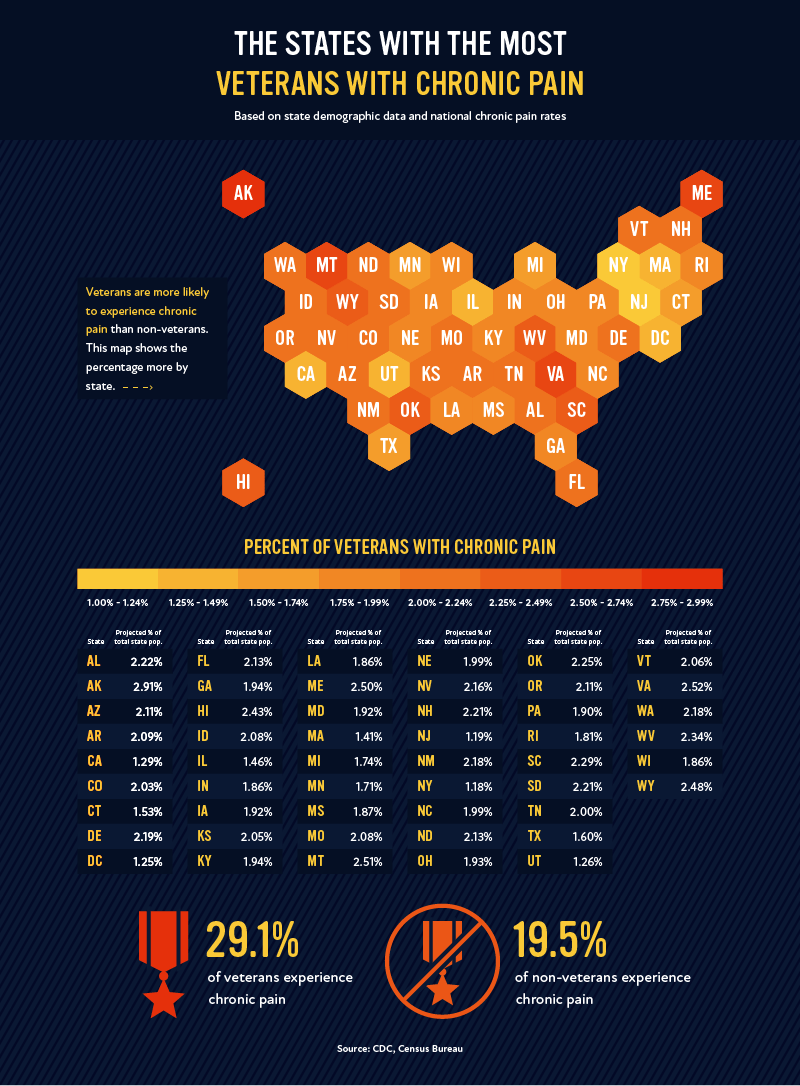
Finally, in light of Veteran’s Day, we thought it was important to look at how chronic pain impacts those who have served our country. In fact, a very large percentage of veterans experience chronic pain, at 29.1%. This is higher than the national average of 20.4%, meaning that being a veteran increases your chances of experiencing chronic pain by nearly 10%.
By looking at the map, we can see where most veterans with chronic pain reside. According to our analysis, the largest percentage of veterans with chronic pain in their state’s population occurs in Alaska (2.91%), Virginia (2.54%), and Montana (2.51%). For resources on pain management and other help for veterans experiencing chronic pain, check out what the U.S. Department of Veterans Affairs has to offer on the topic.
Moving Forward
It’s clear that chronic pain is a condition running rampant in the United States. It requires many resources, long-term care and treatment plans, and a lot of energy, frustration, and fear for those who suffer from it. Based on the rates of chronic pain among the different demographics we explored in this study, it’s also clear that the public health issue of chronic pain isn’t going to be solved overnight. With continued listening to patients, investment in healthy lifestyles, and allocating resources toward non-addictive kinds of treatment for chronic pain, we have the best bet for a future with less chronic pain.
If you live in one of the following cities, your city has the highest concentration of chronic pain management specialists per 100,000 people in the country.
- Hartford, CT
- Milwaukee, WI
- Richmond, VA
- Sacramento, CA
- Orlando, FL
If you or someone you know is suffering from chronic pain, check out the resources below: